HTB Reaper - DFIR (Very Easy)

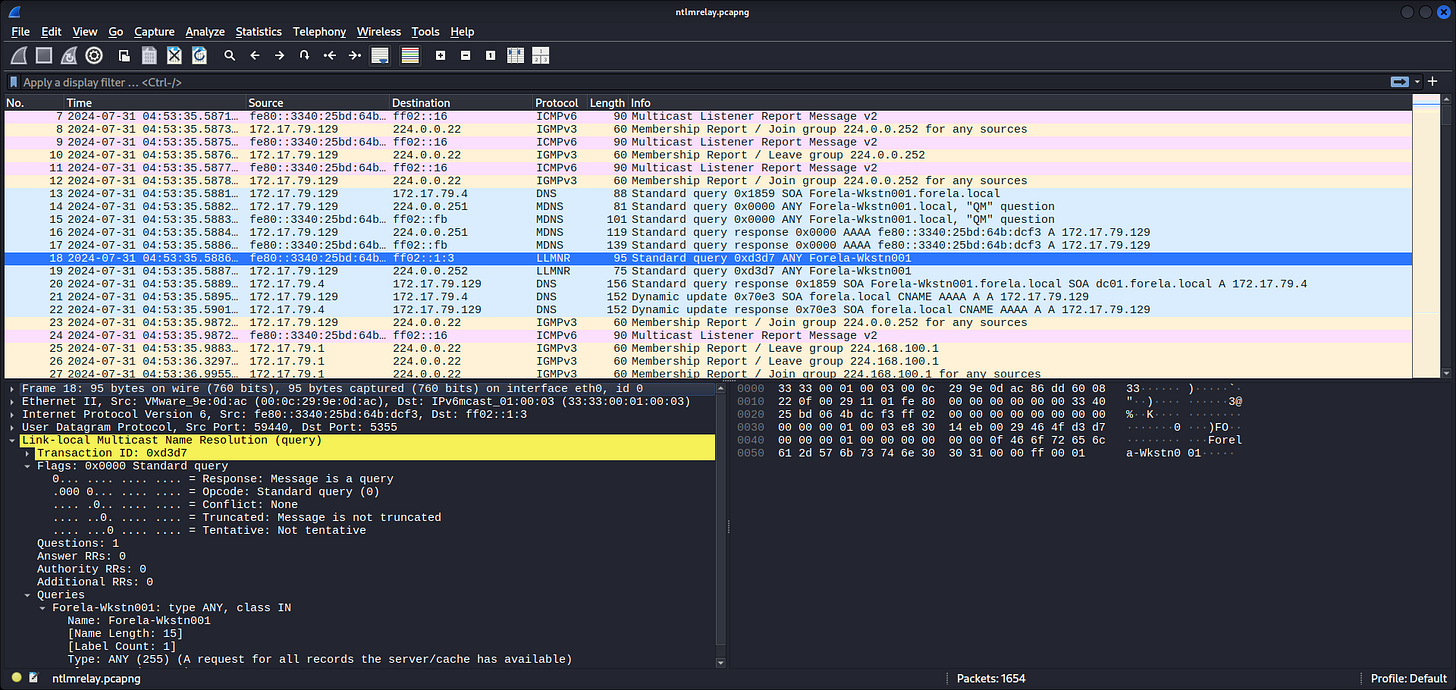
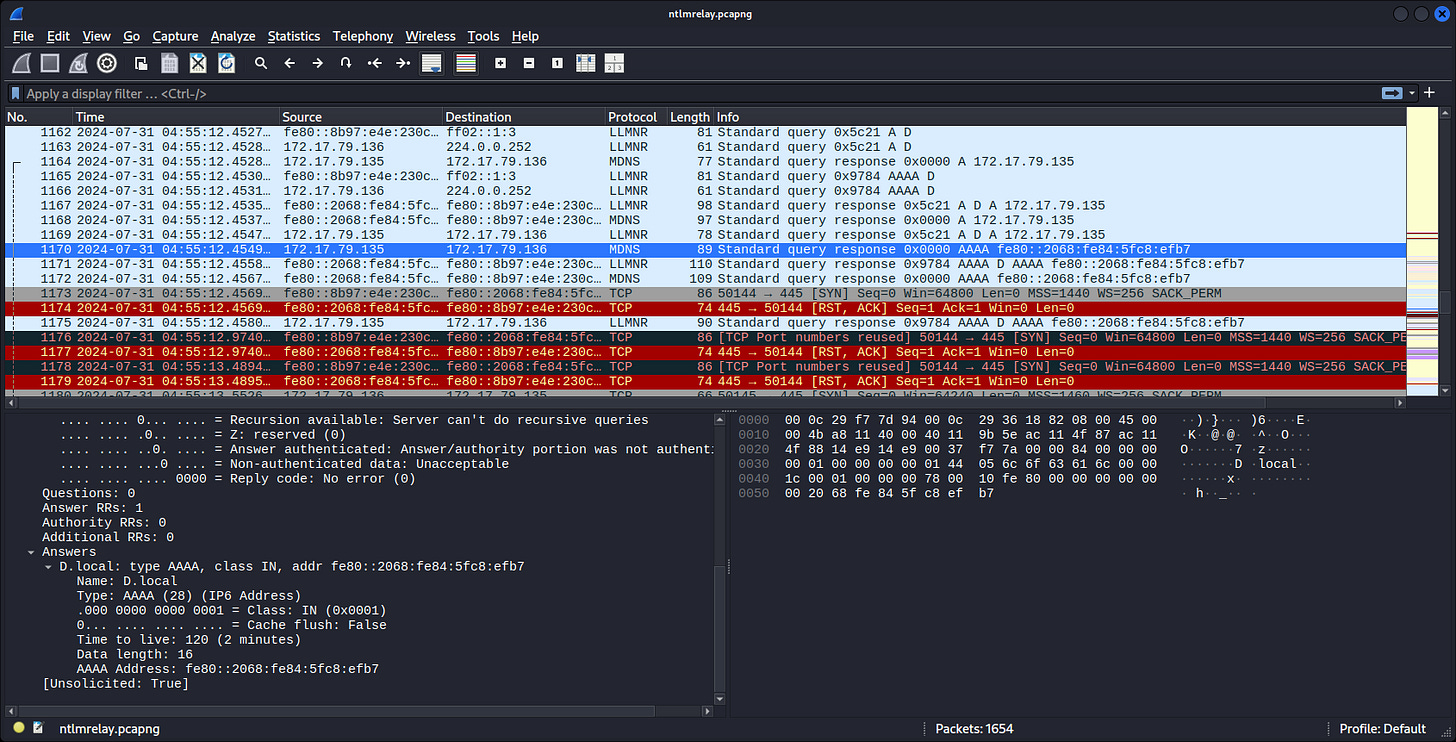
Investigate NTLM Relay attack, the attack starts by network poisoning on LLMNR response when a victim has a typo in the host in shares path. DFIR on given PCAP and Windows Security Log.
From HTB: Our SIEM alerted us to a suspicious logon event which needs to be looked at immediately. The alert details were that the IP Address and the Source Workstation name were a mismatch.
You are provided a network capture and event logs from the surrounding time around the incident timeframe. Corelate the given evidence and report back to your SOC Manager.
Tools, Software, and Services:
-
WireShark
-
Chainsaw
Key Learning:
-
WireShark basic
-
Log Analysis
Task
-
What is the IP Address for Forela-Wkstn001?
-
What is the IP Address for Forela-Wkstn002?
-
Which user account’s hash was stolen by attacker?
-
What is the IP Address of Unknown Device used by the attacker to intercept credentials?
-
What was the fileshare navigated by the victim user account?
-
What is the source port used to logon to target workstation using the compromised account?
-
What is the Logon ID for the malicious session?
-
The detection was based on the mismatch of hostname and the assigned IP Address.What is the workstation name and the source IP Address from which the malicious logon occur?
-
When did the malicious logon happened. Please make sure the timestamp is in UTC?
-
What is the share Name accessed as part of the authentication process by the malicious tool used by the attacker?
Let’s hunt:
┌──(kali㉿kali)-[~]
└─$ tree .
.
└── Reaper
    ├── ntlmrelay.pcapng
    └── Security.evtx
We got the PCAP File, and the Event log to hunt, it should’ve been attached with Sigma rules, etc.
┌──(kali㉿kali)-[~]
└─$ chainsaw hunt --sigma sigma --mapping /usr/share/chainsaw/mappings/sigma-event-logs-all.yml Security.evtx
 ██████╗██╗  ██╗ █████╗ ██╗███╗   ██╗███████╗ █████╗ ██╗    ██╗
██╔════╝██║  ██║██╔══██╗██║████╗  ██║██╔════╝██╔══██╗██║    ██║
██║     ███████║███████║██║██╔██╗ ██║███████╗███████║██║ █╗ ██║
██║     ██╔══██║██╔══██║██║██║╚██╗██║╚════██║██╔══██║██║███╗██║
╚██████╗██║  ██║██║  ██║██║██║ ╚████║███████║██║  ██║╚███╔███╔╝
 ╚═════╝╚═╝  ╚═╝╚═╝  ╚═╝╚═╝╚═╝  ╚═══╝╚══════╝╚═╝  ╚═╝ ╚══╝╚══╝
    By WithSecure Countercept (@FranticTyping, @AlexKornitzer)
[+] Loading detection rules from: sigma
[!] Loaded 3448 detection rules (508 not loaded)
[+] Loading forensic artefacts from: Reaper/Security.evtx (extensions: .evtx, .evt)
[+] Loaded 1 forensic artefacts (1.1 MiB)
[+] Current Artifact: Reaper/Security.evtx
[+] Hunting [========================================] 1/1   [00:00:00]
[+] 0 Detections found on 0 documents
That went ugly.
Let’s make the event log to be seen easily in JSON format, then filter with Jq:
<details> <summary>Click to view bash output</summary>┌──(kali㉿kali)-[~]
└─$ sudo evtx_dump -o jsonl -t 1 -f Security.json Reaper/Security.evtx
┌──(kali㉿kali)-[~]
└─$ ls -al
total 132
drwxr-xr-x 3 root root 4096 Nov 26 00:33 .
drwxr-xr-x 6 root root 4096 Nov 26 00:07 ..
drwxr-xr-x 2 root root 4096 Aug 5 2024 Reaper
-rw-r--r-- 1 root root 119898 Nov 26 00:33 Security.json
┌──(kali㉿kali)-[~]
└─$ cat Security.json | jq .
{
“Event”: {
“#attributes”: {
“xmlns”: “http://schemas.microsoft.com/win/2004/08/events/event”
},
“System”: {
“Provider”: {
“#attributes”: {
“Name”: “Microsoft-Windows-Security-Auditing”,
“Guid”: “54849625-5478-4994-A5BA-3E3B0328C30D”
}
},
“EventID”: 4624,
“Version”: 2,
“Level”: 0,
“Task”: 12544,
“Opcode”: 0,
“Keywords”: “0x8020000000000000”,
“TimeCreated”: {
“#attributes”: {
“SystemTime”: “2024-07-31T04:54:48.626961Z”
}
},
“EventRecordID”: 14607,
“Correlation”: {
“#attributes”: {
“ActivityID”: “FFEDC1A7-E2F8-0005-25C2-EDFFF8E2DA01”
}
}
. . .[SNIP]. . .
Event:
<details> <summary>Click to view text output</summary>┌──(kali㉿kali)-[~]
└─$ cat Security.json | jq . | grep “Event”
“Event”: {
“EventID”: 4624,
“EventRecordID”: 14607,
“EventData”: {
“Event”: {
“EventID”: 4624,
“EventRecordID”: 14608,
“EventData”: {
“Event”: {
“EventID”: 4702,
“EventRecordID”: 14609,
“EventData”: {
“Event”: {
“EventID”: 4624,
“EventRecordID”: 14610,
“EventData”: {
“Event”: {
“EventID”: 5140,
“EventRecordID”: 14611,
“EventData”: {
“Event”: {
“EventID”: 4624,
“EventRecordID”: 14612,
“EventData”: {
“Event”: {
“EventID”: 4624,
“EventRecordID”: 14613,
“EventData”: {
“Event”: {
“EventID”: 4702,
“EventRecordID”: 14614,
“EventData”: {
“Event”: {
“EventID”: 4624,
“EventRecordID”: 14615,
“EventData”: {
“Event”: {
“EventID”: 4702,
“EventRecordID”: 14616,
“EventData”: {
“Event”: {
“EventID”: 4702,
“EventRecordID”: 14617,
“EventData”: {
“Event”: {
“EventID”: 4702,
“EventRecordID”: 14618,
“EventData”: {
“Event”: {
“EventID”: 4702,
“EventRecordID”: 14619,
“EventData”: {
“Event”: {
“EventID”: 4702,
“EventRecordID”: 14620,
“EventData”: {
“Event”: {
“EventID”: 4702,
“EventRecordID”: 14621,
“EventData”: {
“Event”: {
“EventID”: 4702,
“EventRecordID”: 14622,
“EventData”: {
“Event”: {
“EventID”: 4702,
“EventRecordID”: 14623,
“EventData”: {
“Event”: {
“EventID”: 4702,
“EventRecordID”: 14624,
“EventData”: {
“Event”: {
“EventID”: 4702,
“EventRecordID”: 14625,
“EventData”: {
“Event”: {
“EventID”: 4702,
“EventRecordID”: 14626,
“EventData”: {
“Event”: {
“EventID”: 4702,
“EventRecordID”: 14627,
“EventData”: {
“Event”: {
“EventID”: 4702,
“EventRecordID”: 14628,
“EventData”: {
“Event”: {
“EventID”: 4702,
“EventRecordID”: 14629,
“EventData”: {
“Event”: {
“EventID”: 4702,
“EventRecordID”: 14630,
“EventData”: {
“Event”: {
“EventID”: 4702,
“EventRecordID”: 14631,
“EventData”: {
“Event”: {
“EventID”: 4702,
“EventRecordID”: 14632,
“EventData”: {
“Event”: {
“EventID”: 4702,
“EventRecordID”: 14633,
“EventData”: {
“Event”: {
“EventID”: 4702,
“EventRecordID”: 14634,
“EventData”: {
“Event”: {
“EventID”: 4702,
“EventRecordID”: 14635,
“EventData”: {
“Event”: {
“EventID”: 4702,
“EventRecordID”: 14636,
“EventData”: {
“Event”: {
“EventID”: 4702,
“EventRecordID”: 14637,
“EventData”: {
“Event”: {
“EventID”: 4702,
“EventRecordID”: 14638,
“EventData”: {
“Event”: {
“EventID”: 4702,
“EventRecordID”: 14639,
“EventData”: {
“Event”: {
“EventID”: 4624,
“EventRecordID”: 14640,
“EventData”: {
“Event”: {
“EventID”: 4624,
“EventRecordID”: 14641,
“EventData”: {
“Event”: {
“EventID”: 4702,
“EventRecordID”: 14642,
“EventData”: {
“Event”: {
“EventID”: 4624,
“EventRecordID”: 14643,
“EventData”: {
“Event”: {
“EventID”: 4624,
“EventRecordID”: 14644,
“EventData”: {
“Event”: {
“EventID”: 4702,
“EventRecordID”: 14645,
“EventData”: {
“Event”: {
“EventID”: 4702,
“EventRecordID”: 14646,
“EventData”: {
“Event”: {
“EventID”: 4702,
“EventRecordID”: 14647,
“EventData”: {
“Event”: {
“EventID”: 4702,
“EventRecordID”: 14648,
“EventData”: {
“Event”: {
“EventID”: 4702,
“EventRecordID”: 14649,
“EventData”: {
“Event”: {
“EventID”: 4702,
“EventRecordID”: 14650,
“EventData”: {
“Event”: {
“EventID”: 4702,
“EventRecordID”: 14651,
“EventData”: {
“Event”: {
“EventID”: 4702,
“EventRecordID”: 14652,
“EventData”: {
“Event”: {
“EventID”: 4702,
“EventRecordID”: 14653,
“EventData”: {
“Event”: {
“EventID”: 4702,
“EventRecordID”: 14654,
“EventData”: {
“Event”: {
“EventID”: 4702,
“EventRecordID”: 14655,
“EventData”: {
“Event”: {
“EventID”: 4662,
“EventRecordID”: 14656,
“EventData”: {
“Event”: {
“EventID”: 4624,
“EventRecordID”: 14657,
“EventData”: {
Let’s count:
<details> <summary>Click to view text output</summary>┌──(kali㉿kali)-[~]
└─$ cat Security.json | jq '.Event.System.Computer'
“Forela-Wkstn001.forela.local”
“Forela-Wkstn001.forela.local”
“Forela-Wkstn001.forela.local”
“Forela-Wkstn001.forela.local”
“Forela-Wkstn001.forela.local”
“Forela-Wkstn001.forela.local”
“Forela-Wkstn001.forela.local”
“Forela-Wkstn001.forela.local”
“Forela-Wkstn001.forela.local”
“Forela-Wkstn001.forela.local”
“Forela-Wkstn001.forela.local”
“Forela-Wkstn001.forela.local”
“Forela-Wkstn001.forela.local”
“Forela-Wkstn001.forela.local”
“Forela-Wkstn001.forela.local”
“Forela-Wkstn001.forela.local”
“Forela-Wkstn001.forela.local”
“Forela-Wkstn001.forela.local”
“Forela-Wkstn001.forela.local”
. . .[SNIP]. . .
┌──(kali㉿kali)-[~]
└─$ cat Security.json | jq ‘.Event.System.Computer’ | wc -l
51
┌──(kali㉿kali)-[~]
└─$ cat Security.json | jq ‘.Event.System.EventID’ | sort | uniq -c | sort -nr
     38 4702
     11 4624
      1 5140
      1 4662
Let’s now getting the help fur hunting down event logs with the Other PCAP files, in order to seek the evidence, IP, etc.
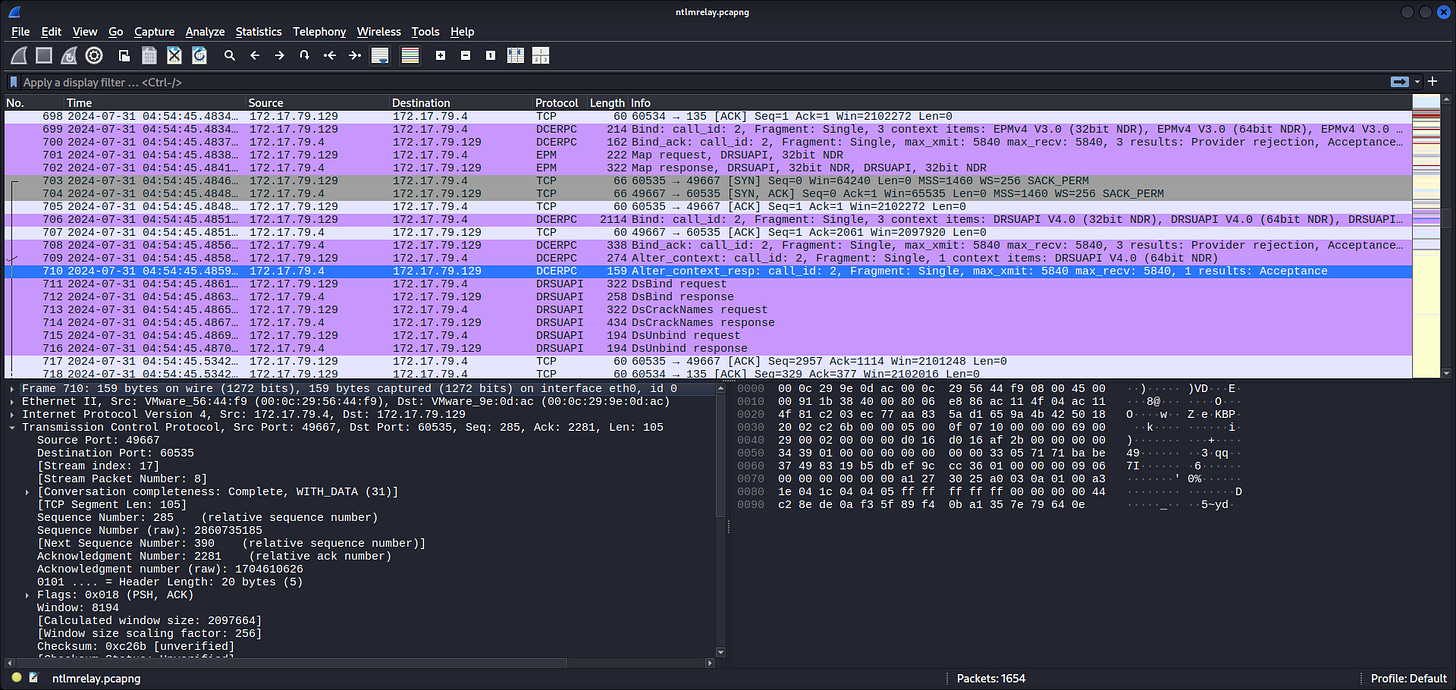
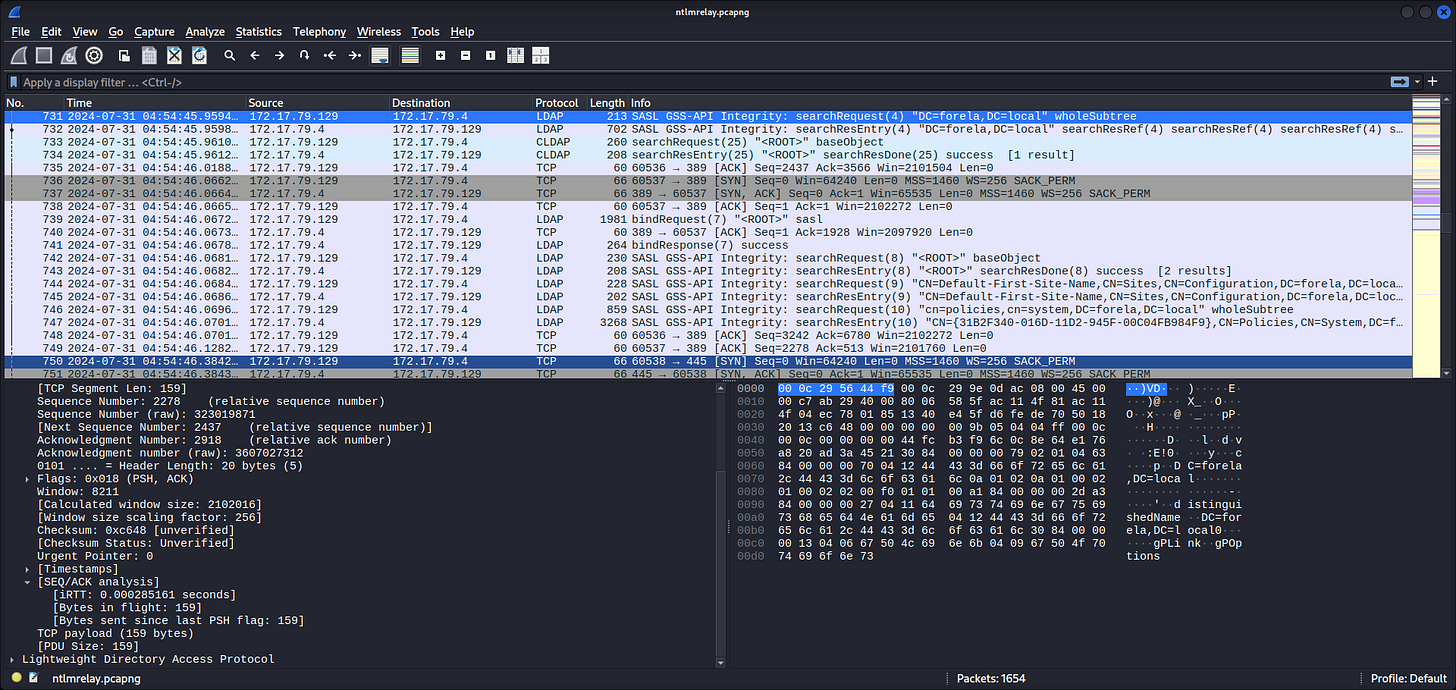
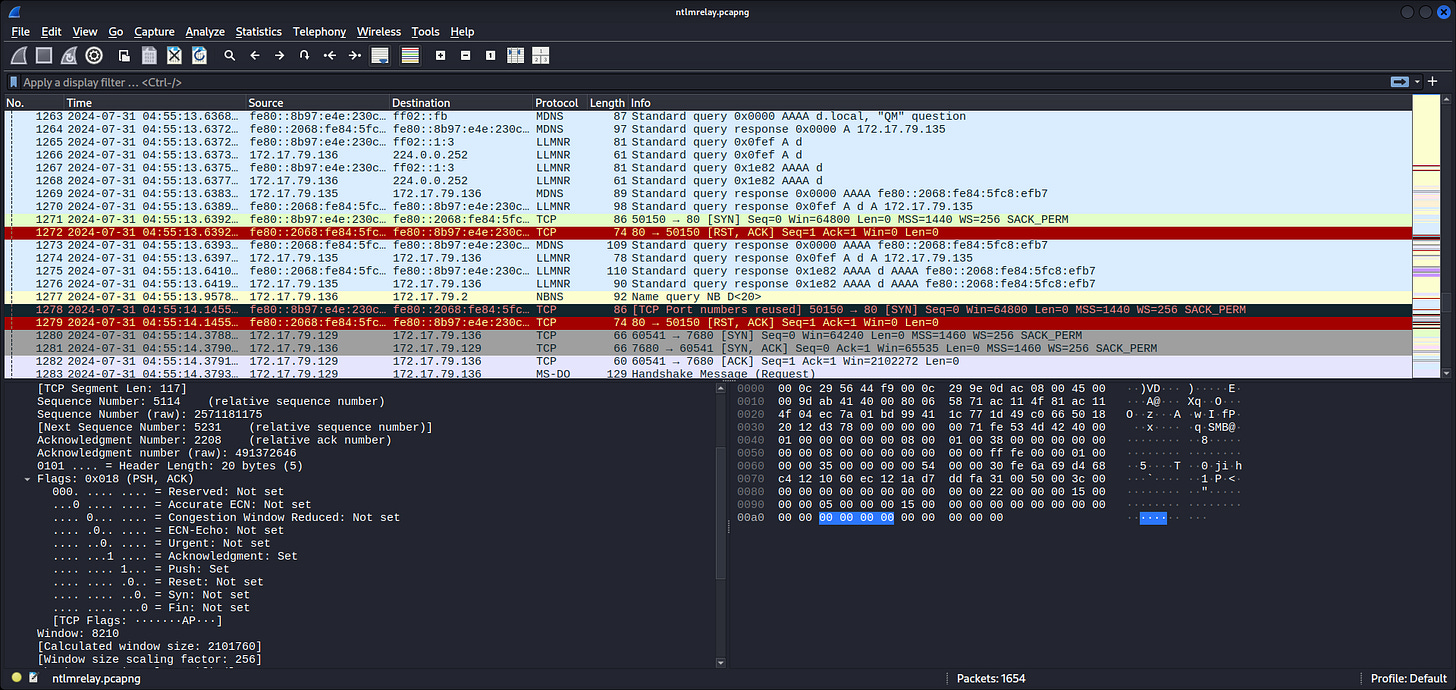
Seems in range for 172.17.79.0/24, which is likely the private network of Forela here. On the TCP tab, the low ports observed are:
80, 88, 135, 389, 443, 445
┌──(kali㉿kali)-[~]
└─$ cat Security.json | jq ‘select(.Event.System.EventID==9120)’

┌──(kali㉿kali)-[~]
└─$ cat Security.json | jq ‘select(.Event.System.EventID==5140)’
{
  “Event”: {
    “#attributes”: {
      “xmlns”: “http://schemas.microsoft.com/win/2004/08/events/event”
    },
    “System”: {
      “Provider”: {
        “#attributes”: {
          “Name”: “Microsoft-Windows-Security-Auditing”,
          “Guid”: “54849625-5478-4994-A5BA-3E3B0328C30D”
        }
      },
      “EventID”: 5140,
      “Version”: 1,
      “Level”: 0,
      “Task”: 12808,
      “Opcode”: 0,
      “Keywords”: “0x8020000000000000”,
      “TimeCreated”: {
        “#attributes”: {
          “SystemTime”: “2024-07-31T04:55:16.243325Z”
        }
      },
      “EventRecordID”: 14611,
      “Correlation”: null,
      “Execution”: {
        “#attributes”: {
          “ProcessID”: 4,
          “ThreadID”: 4820
        }
      },
      “Channel”: “Security”,
      “Computer”: “Forela-Wkstn001.forela.local”,
      “Security”: null
    },
    “EventData”: {
      “SubjectUserSid”: “S-1-5-21-3239415629-1862073780-2394361899-1601”,
      “SubjectUserName”: “arthur.kyle”,
      “SubjectDomainName”: “FORELA”,
      “SubjectLogonId”: “0x64a799”,
      “ObjectType”: “File”,
      “IpAddress”: “172.17.79.135”,
      “IpPort”: “40252”,
      “ShareName”: “\\\\*\\IPC$”,
      “ShareLocalPath”: “”,
      “AccessMask”: “0x1”,
      “AccessList”: “%%4416”
    }
  }
}
┌──(kali㉿kali)-[~]
└─$ cat Security.json | jq ‘.Event.EventData.IpAddress’
“::1”
“::1”
null
“172.17.79.135”
“172.17.79.135”
IP:
172.17.79.135
172.17.79.135
┌──(kali㉿kali)-[~]
└─$ cat Security.json | jq ‘select(.Event.System.EventID==4624 and .Event.EventData.IpAddress==”172.17.79.135”)’
{
  “Event”: {
    “#attributes”: {
      “xmlns”: “http://schemas.microsoft.com/win/2004/08/events/event”
    },
    “System”: {
      “Provider”: {
        “#attributes”: {
          “Name”: “Microsoft-Windows-Security-Auditing”,
          “Guid”: “54849625-5478-4994-A5BA-3E3B0328C30D”
        }
      },
      “EventID”: 4624,
      “Version”: 2,
      “Level”: 0,
      “Task”: 12544,
      “Opcode”: 0,
      “Keywords”: “0x8020000000000000”,
      “TimeCreated”: {
        “#attributes”: {
          “SystemTime”: “2024-07-31T04:55:16.240589Z”
        }
      },
      “EventRecordID”: 14610,
      “Correlation”: {
        “#attributes”: {
          “ActivityID”: “FFEDC1A7-E2F8-0005-25C2-EDFFF8E2DA01”
        }
      },
      “Execution”: {
        “#attributes”: {
          “ProcessID”: 784,
          “ThreadID”: 9120
        }
      },
      “Channel”: “Security”,
      “Computer”: “Forela-Wkstn001.forela.local”,
      “Security”: null
    },
    “EventData”: {
      “SubjectUserSid”: “S-1-0-0”,
      “SubjectUserName”: “-”,
      “SubjectDomainName”: “-”,
      “SubjectLogonId”: “0x0”,
      “TargetUserSid”: “S-1-5-21-3239415629-1862073780-2394361899-1601”,
      “TargetUserName”: “arthur.kyle”,
      “TargetDomainName”: “FORELA”,
      “TargetLogonId”: “0x64a799”,
      “LogonType”: 3,
      “LogonProcessName”: “NtLmSsp”,
      “AuthenticationPackageName”: “NTLM”,
      “WorkstationName”: “FORELA-WKSTN002”,
      “LogonGuid”: “00000000-0000-0000-0000-000000000000”,
      “TransmittedServices”: “-”,
      “LmPackageName”: “NTLM V2”,
      “KeyLength”: 128,
      “ProcessId”: “0x0”,
      “ProcessName”: “-”,
      “IpAddress”: “172.17.79.135”,
      “IpPort”: “40252”,
      “ImpersonationLevel”: “%%1833”,
      “RestrictedAdminMode”: “-”,
      “TargetOutboundUserName”: “-”,
      “TargetOutboundDomainName”: “-”,
      “VirtualAccount”: “%%1843”,
      “TargetLinkedLogonId”: “0x0”,
      “ElevatedToken”: “%%1843”
    }
  }
}
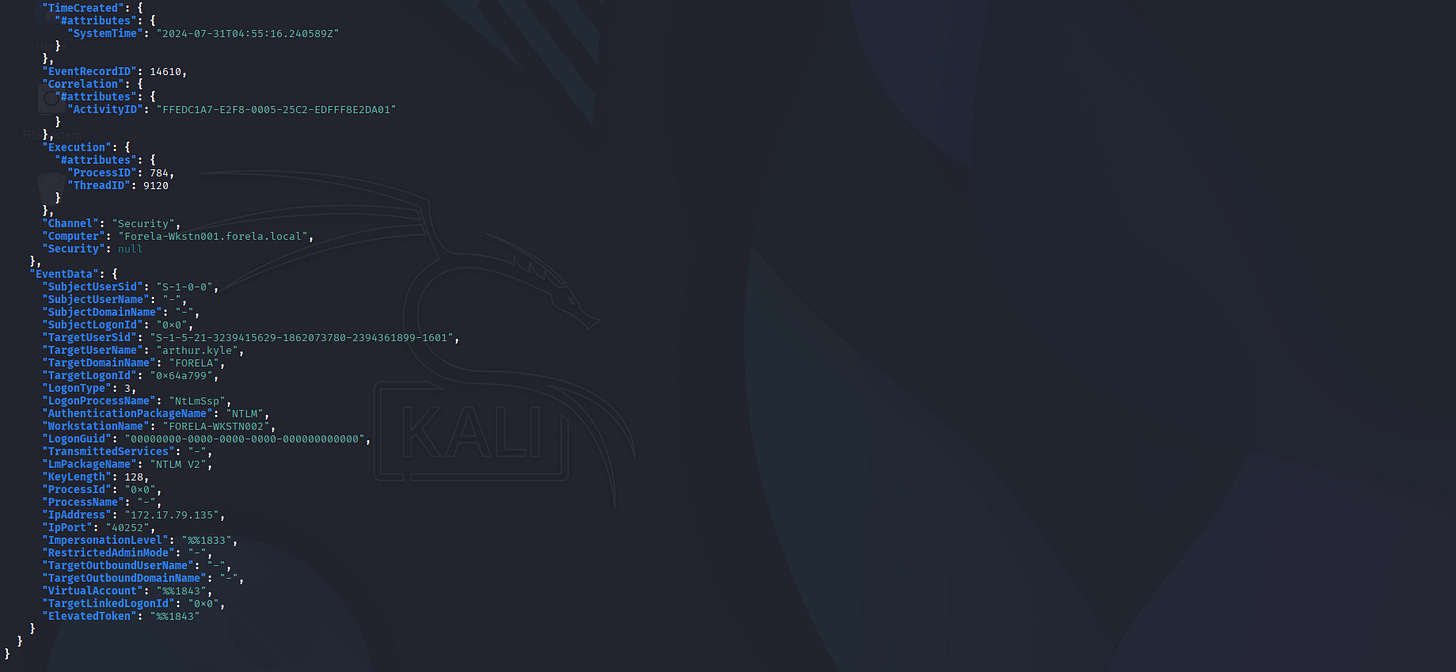
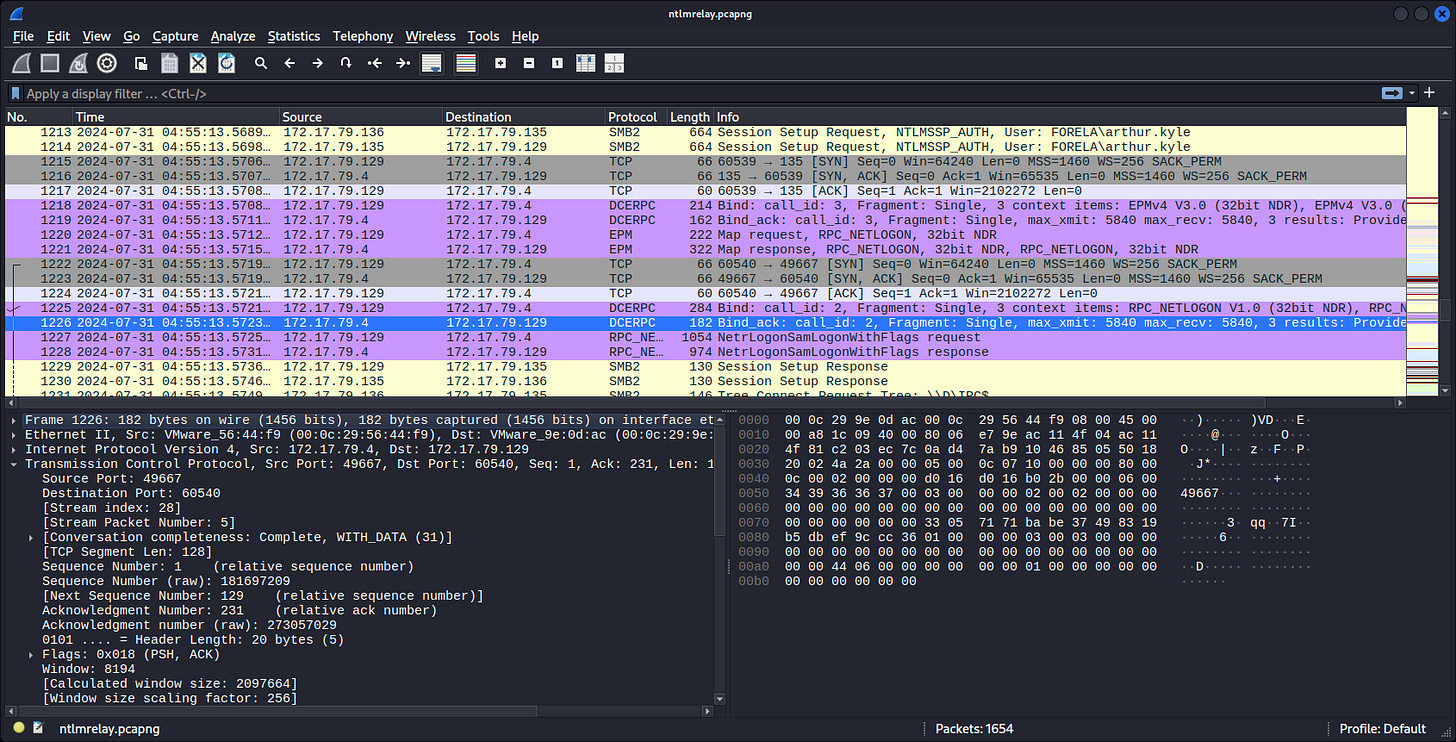
This is the authentication attempt at WKSTN001 from WKSTN002 but from the attacker’s IP as arthur.kyle.
┌──(kali㉿kali)-[~]
└─$ cat Security.json | jq ‘select(.Event.System.EventID==4624 and .Event.EventData.IpAddress==”172.17.79.135”) | .Event | {”SrcIP”: .EventData.IpAddress, “SrcPort”: .EventData.IpPort, “SrcHost”: .EventData.WorkstationName, “Username”: .EventData.TargetUserName, “LogonID”: .EventData.TargetLogonId, “TargetHost”: .System.Computer, “AuthPackage”: .EventData.LmPackageName}’
{
  “SrcIP”: “172.17.79.135”,
  “SrcPort”: “40252”,
  “SrcHost”: “FORELA-WKSTN002”,
  “Username”: “arthur.kyle”,
  “LogonID”: “0x64a799”,
  “TargetHost”: “Forela-Wkstn001.forela.local”,
  “AuthPackage”: “NTLM V2”
}
So yeah, that’s basically all of it and our review supposed to be enough for this malware analysis report:
- What is the IP Address for Forela-Wkstn001?
172.17.79.129
- What is the IP Address for Forela-Wkstn002?
172.17.79.136
- Which user account’s hash was stolen by attacker?
arthur.kyle
- What is the IP Address of Unknown Device used by the attacker to intercept credentials?
172.17.79.135
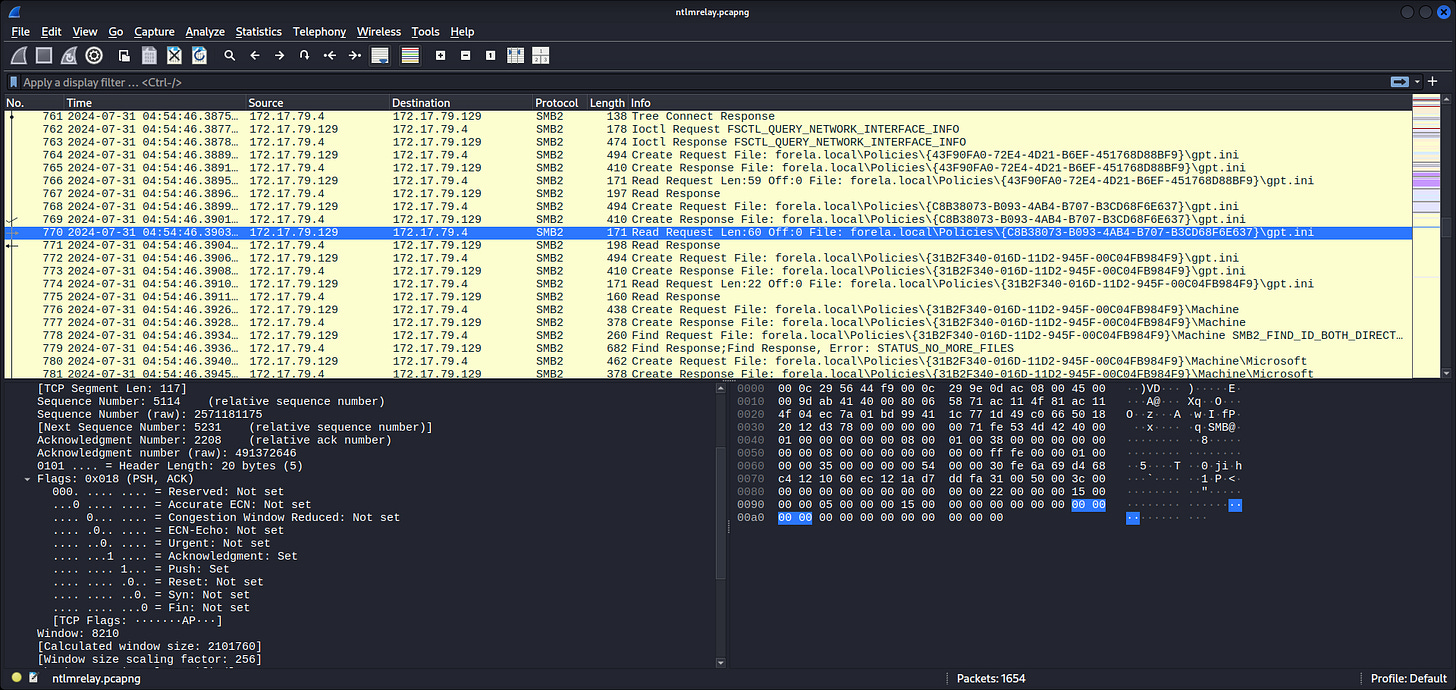
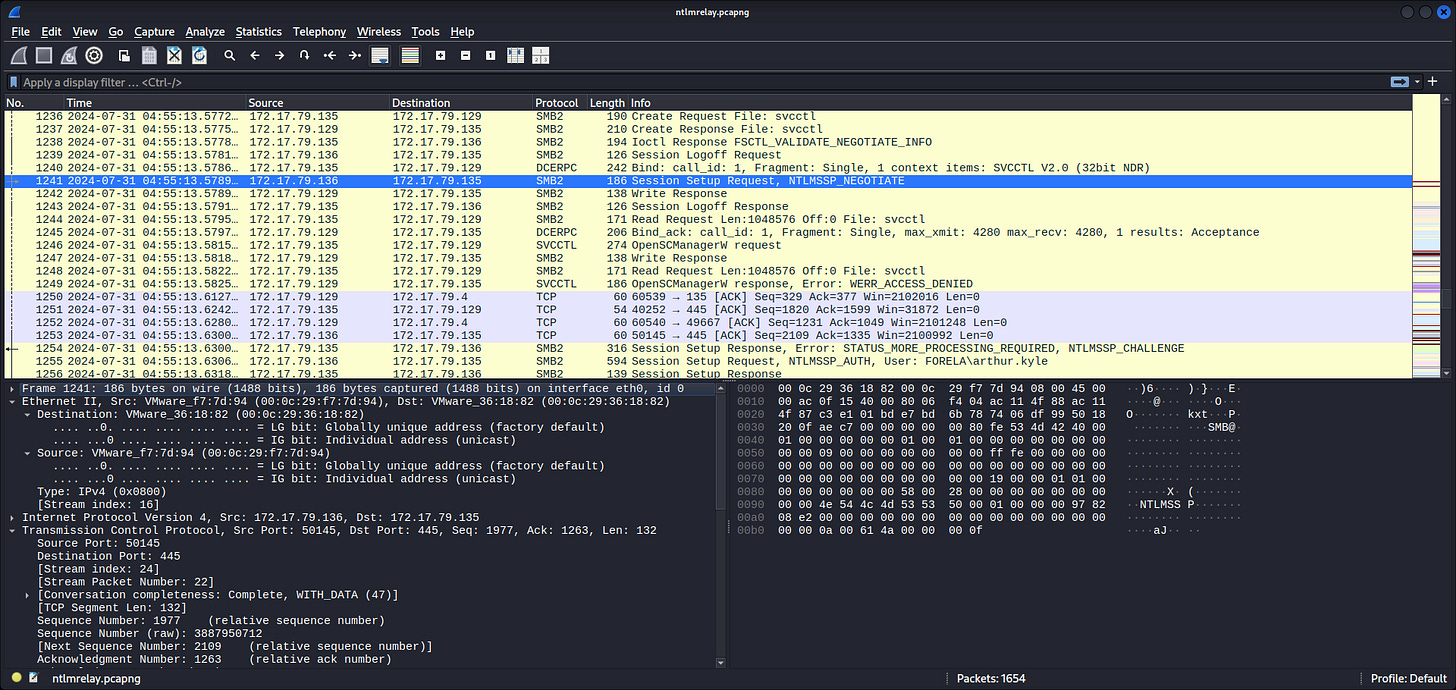
- What was the fileshare navigated by the victim user account?
\\DC01\Trip
- What is the source port used to logon to target workstation using the compromised account?
40252
- What is the Logon ID for the malicious session?
0x64A799
- The detection was based on the mismatch of hostname and the assigned IP Address.What is the workstation name and the source IP Address from which the malicious logon occur?
FORELA-WKSTN002, 172.17.79.135
- When did the malicious logon happened. Please make sure the timestamp is in UTC?
2024-07-31 04:55:16
- What is the share Name accessed as part of the authentication process by the malicious tool used by the attacker?
\\*\IPC$
That’s it.
Happy Defending, Thanks HackTheBox